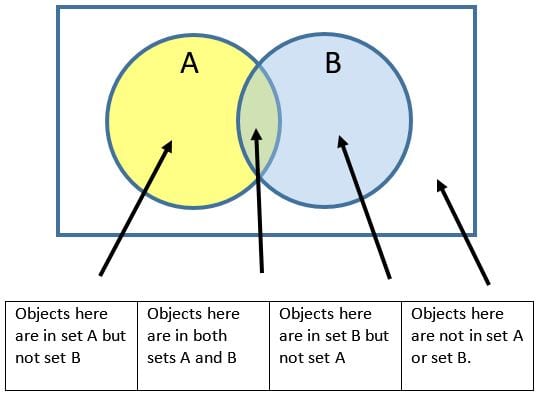
Venn Diagrams
Simply put, a Venn Diagram is a tool to help us sort things. A man named John Venn (a logician) invented them a long time ago.
Have a look below at the diagram.
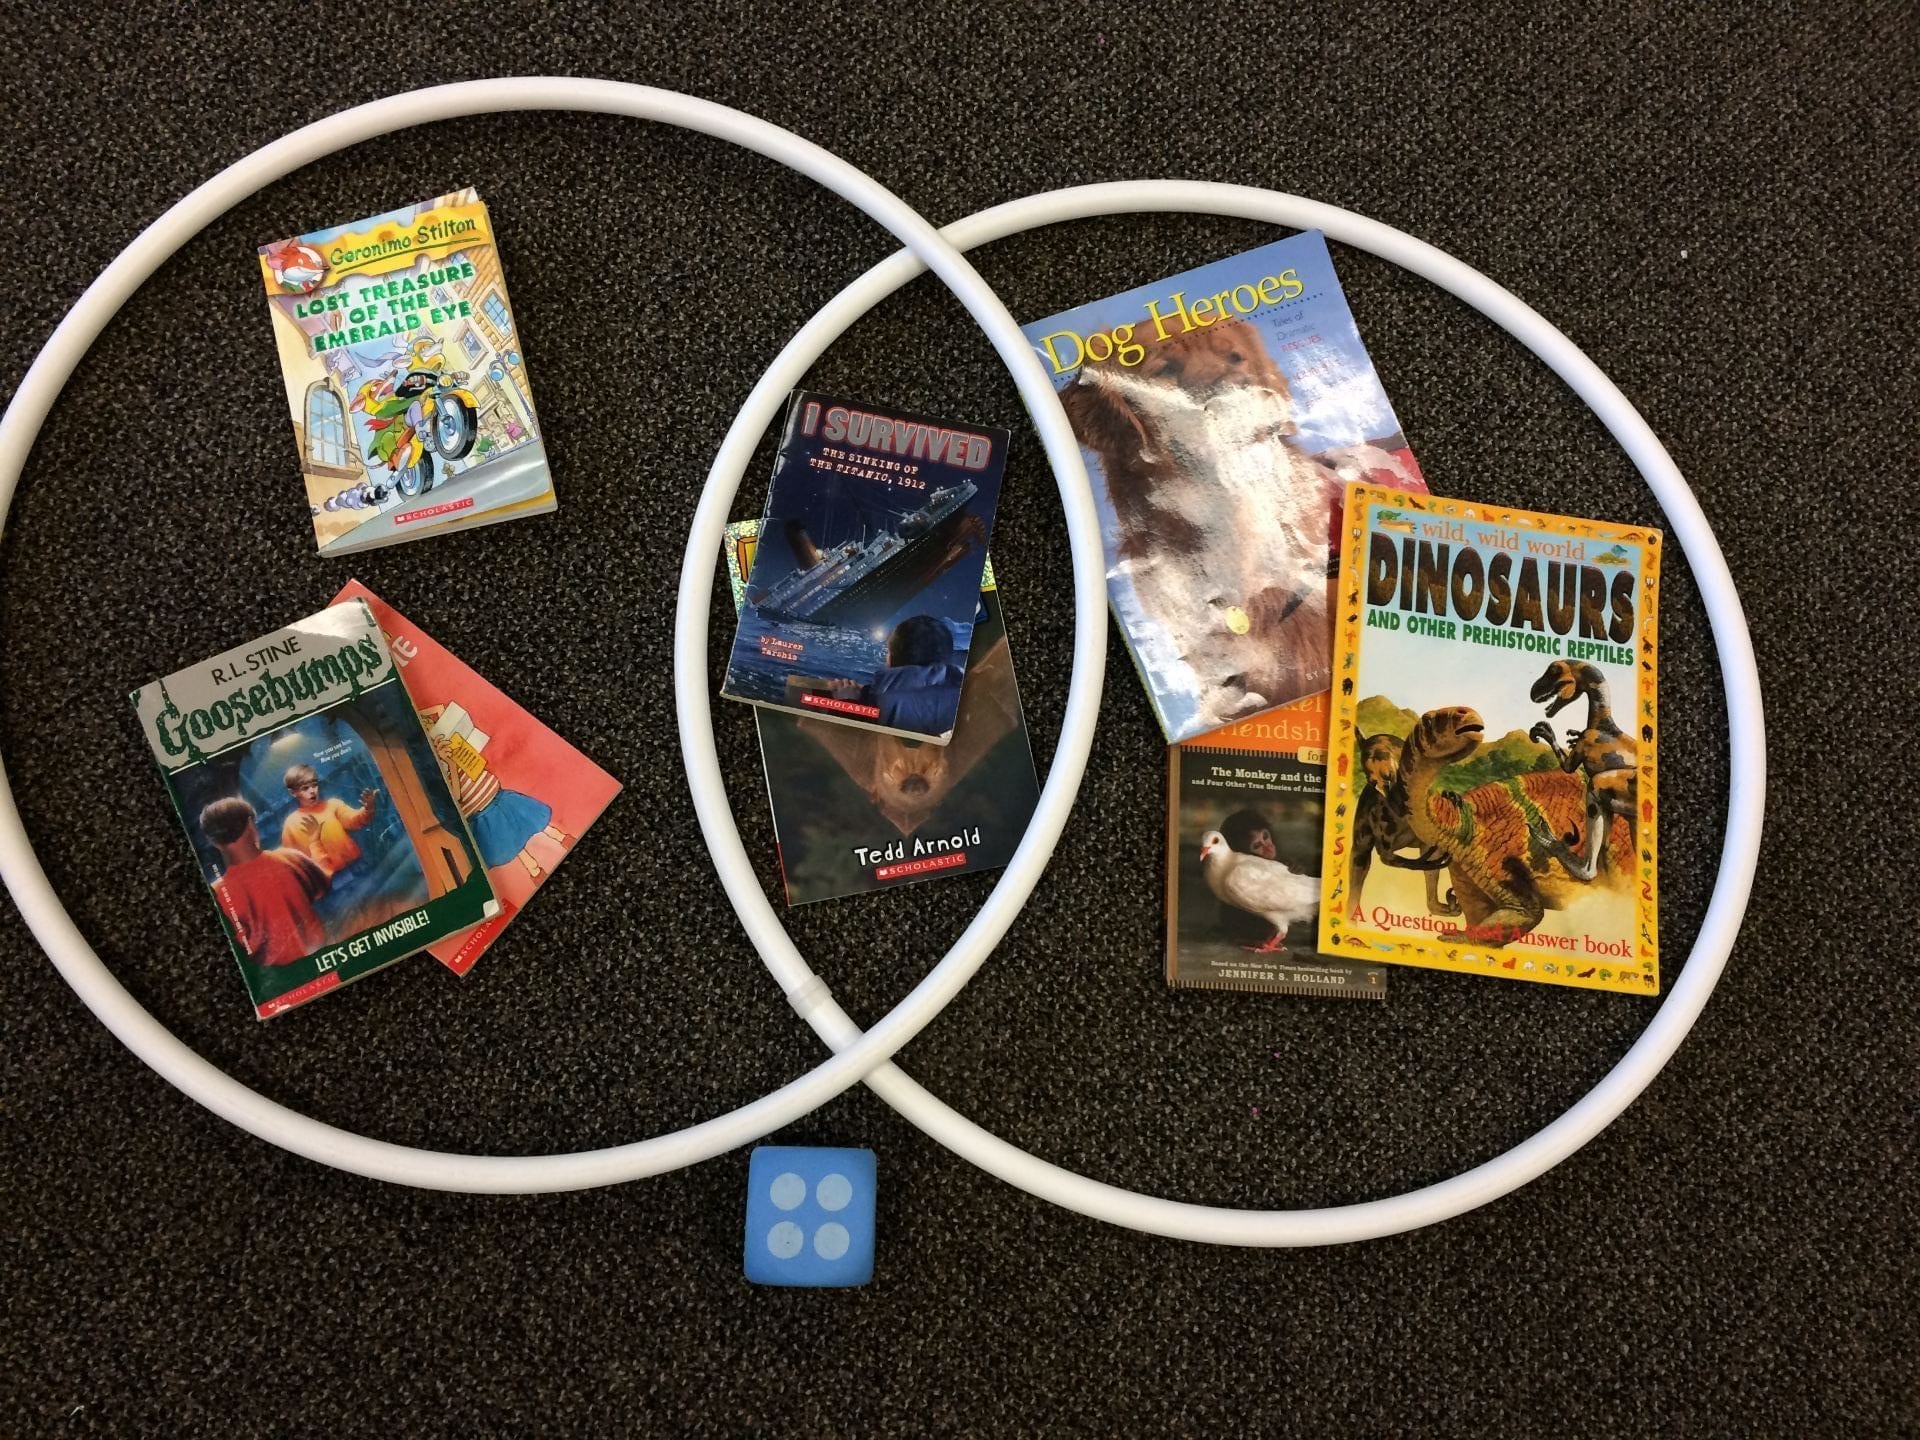
We made some of our own Venn Diagrams using hula hoops and various objects we found around the class. Can you guess how we sorted the following items in the pictures?

You will notice one item (a clipboard) placed outside the Venn Diagram. That is because it doesn’t belong in any of the categories within the Diagram.
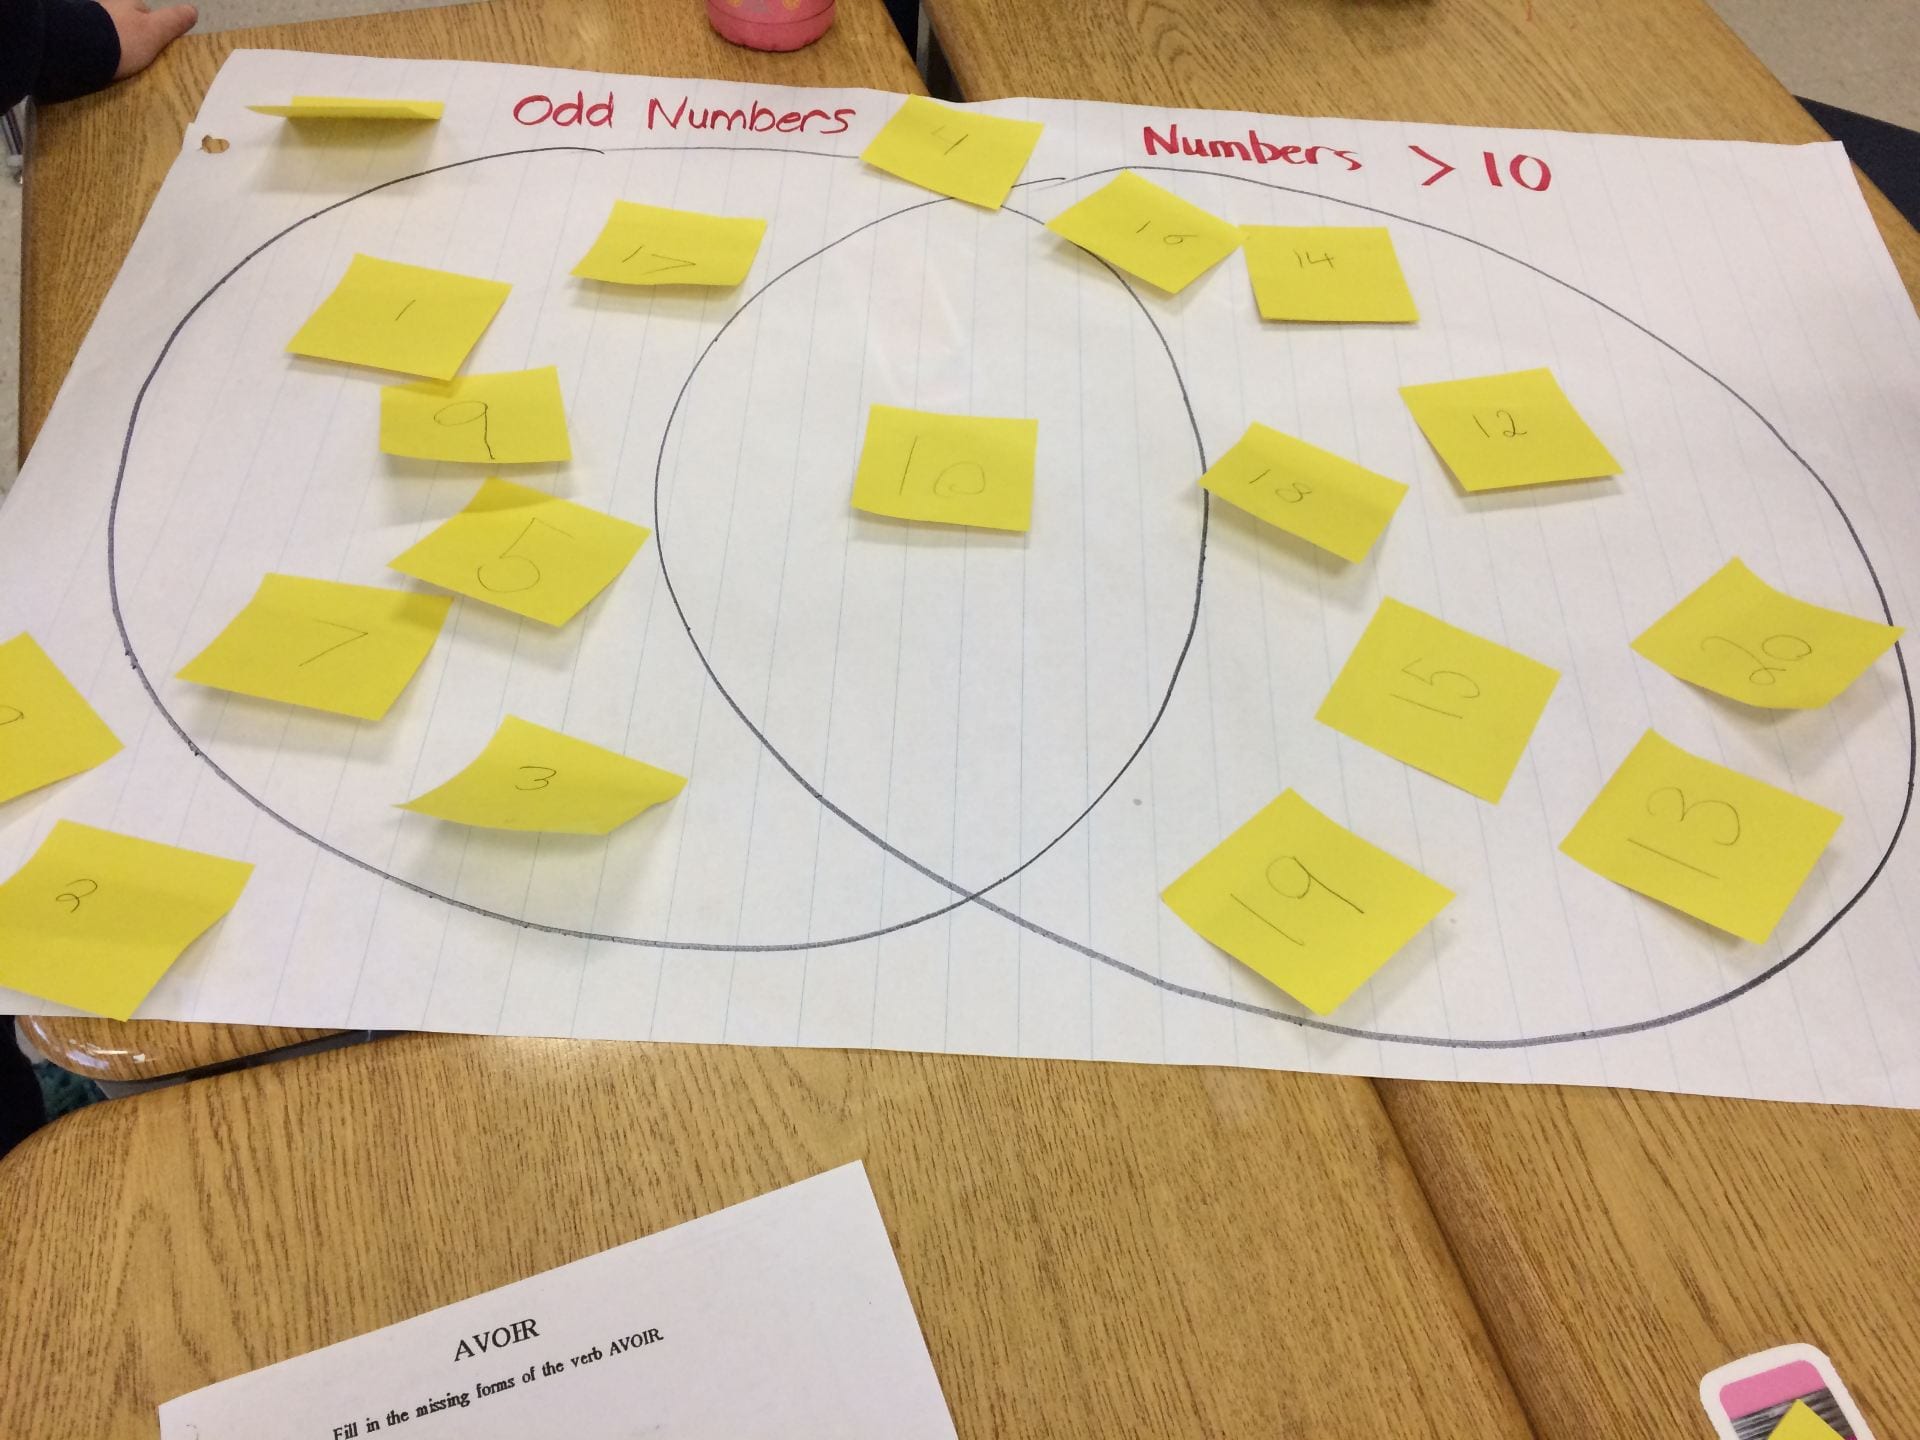
Students have been working in their teams to sort numbers as well. Have a look at the action. Click on individual pictures to enlarge them:


Recently, Mrs. Sullivan created a Venn Diagram with fiction and nonfiction books. Students had to guess how the diagram was sorted and find other books to add to the Venn Diagram.
What kind of items could you sort into a Venn Diagram?